Free & open source · GPL-3.0

Multi-platform database monitoring, without the agents or the invoice.

DbMonitor covers SQL Server, MySQL, PostgreSQL, and MongoDB from a single web interface. No agents to deploy, no per-server licensing, no subscription. Self-hosted on IIS or Docker — your data never leaves your network.

Why DbMonitor

No compromises on platform, agents, or cost

Most database monitoring tools make one of three compromises: SQL Server only, agents on every host, or a price tag bigger than the infrastructure they watch. DbMonitor makes none of those.

Multi-platform from the ground up

  • SQL Server, MySQL, PostgreSQL, and MongoDB treated as first-class citizens, not afterthoughts

Agentless

  • Connects directly to database instances; nothing to install on monitored servers

Read and act

  • Process kill and AG/InnoDB/Patroni/MongoDB failover built in, gated by role — not just dashboards

Audit-friendly

  • In Windows Authentication mode, the Query Tool runs under the logged-in user's identity via Kerberos delegation, so every ad-hoc query is attributed to the person who ran it

Screens

What it looks like day to day
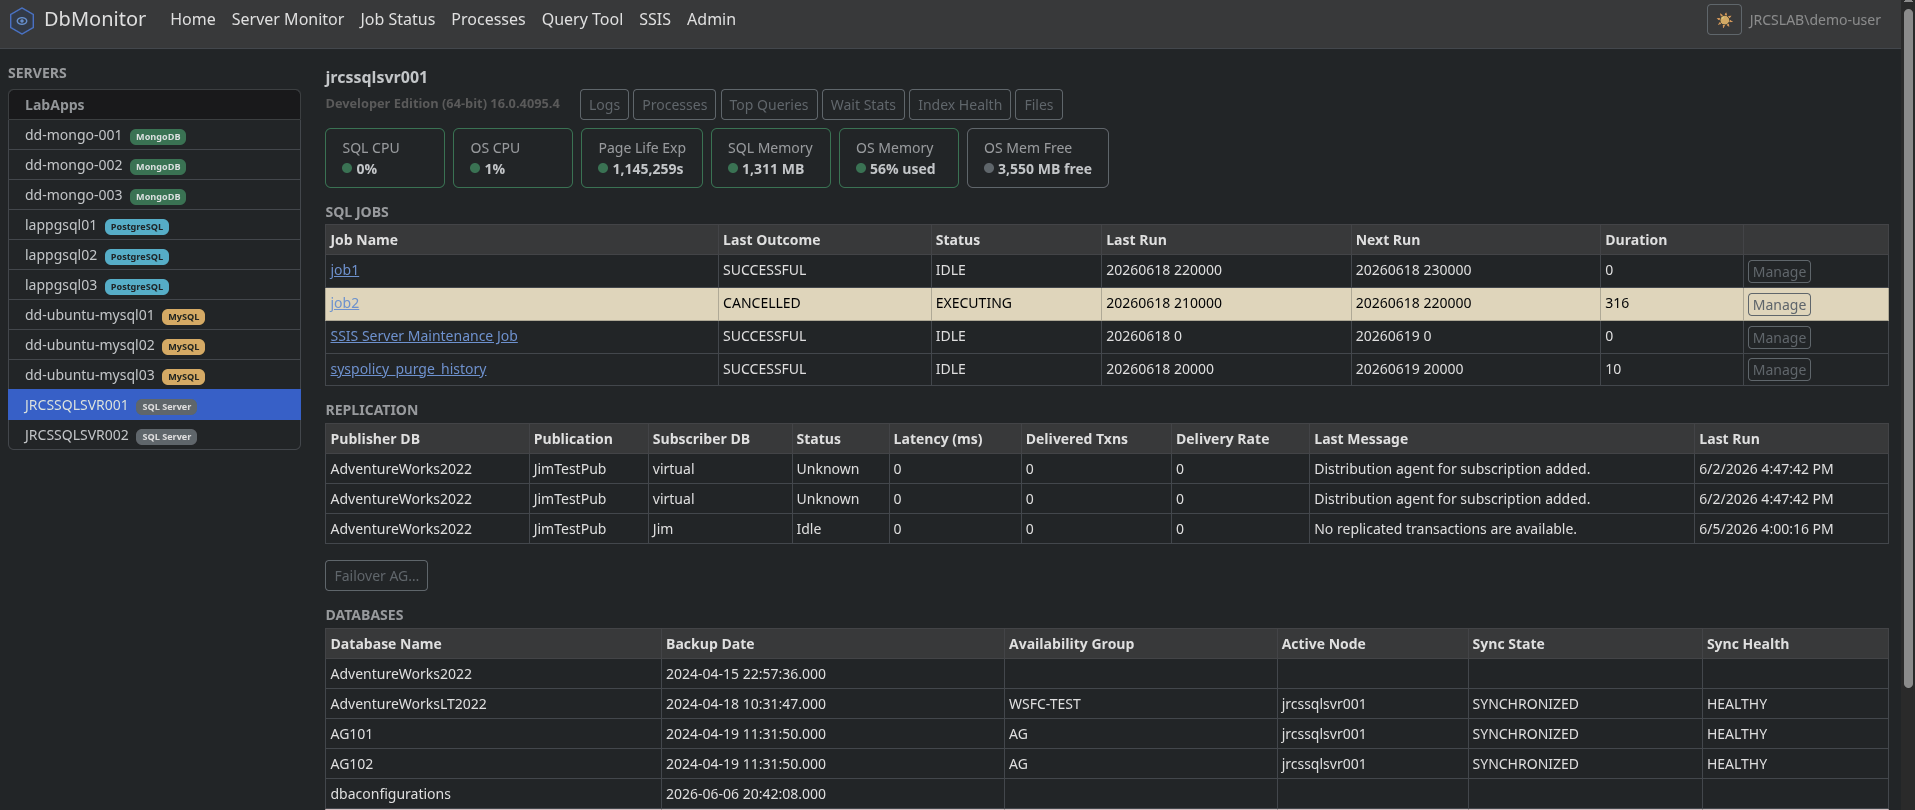
Server Monitor for SQL Server showing jobs, replication topology, and database backup status

Server Monitor — SQL Server jobs, AG topology, and backup status.
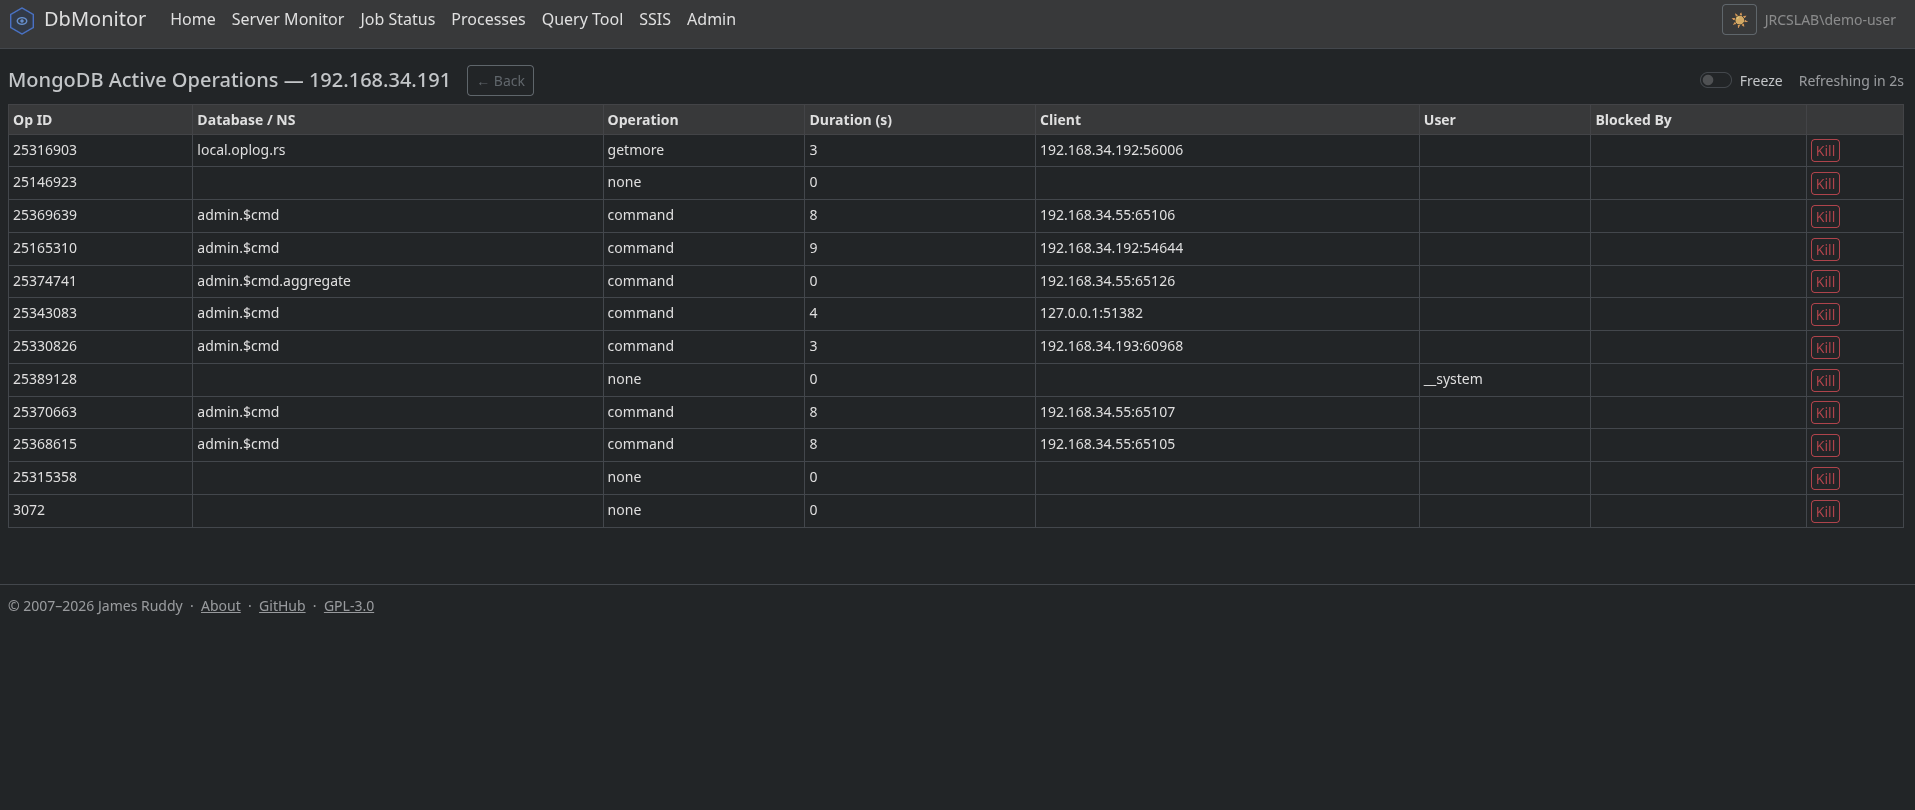
Active Operations page showing a MongoDB live session list with Kill actions

Active Operations — MongoDB live sessions with Kill actions.
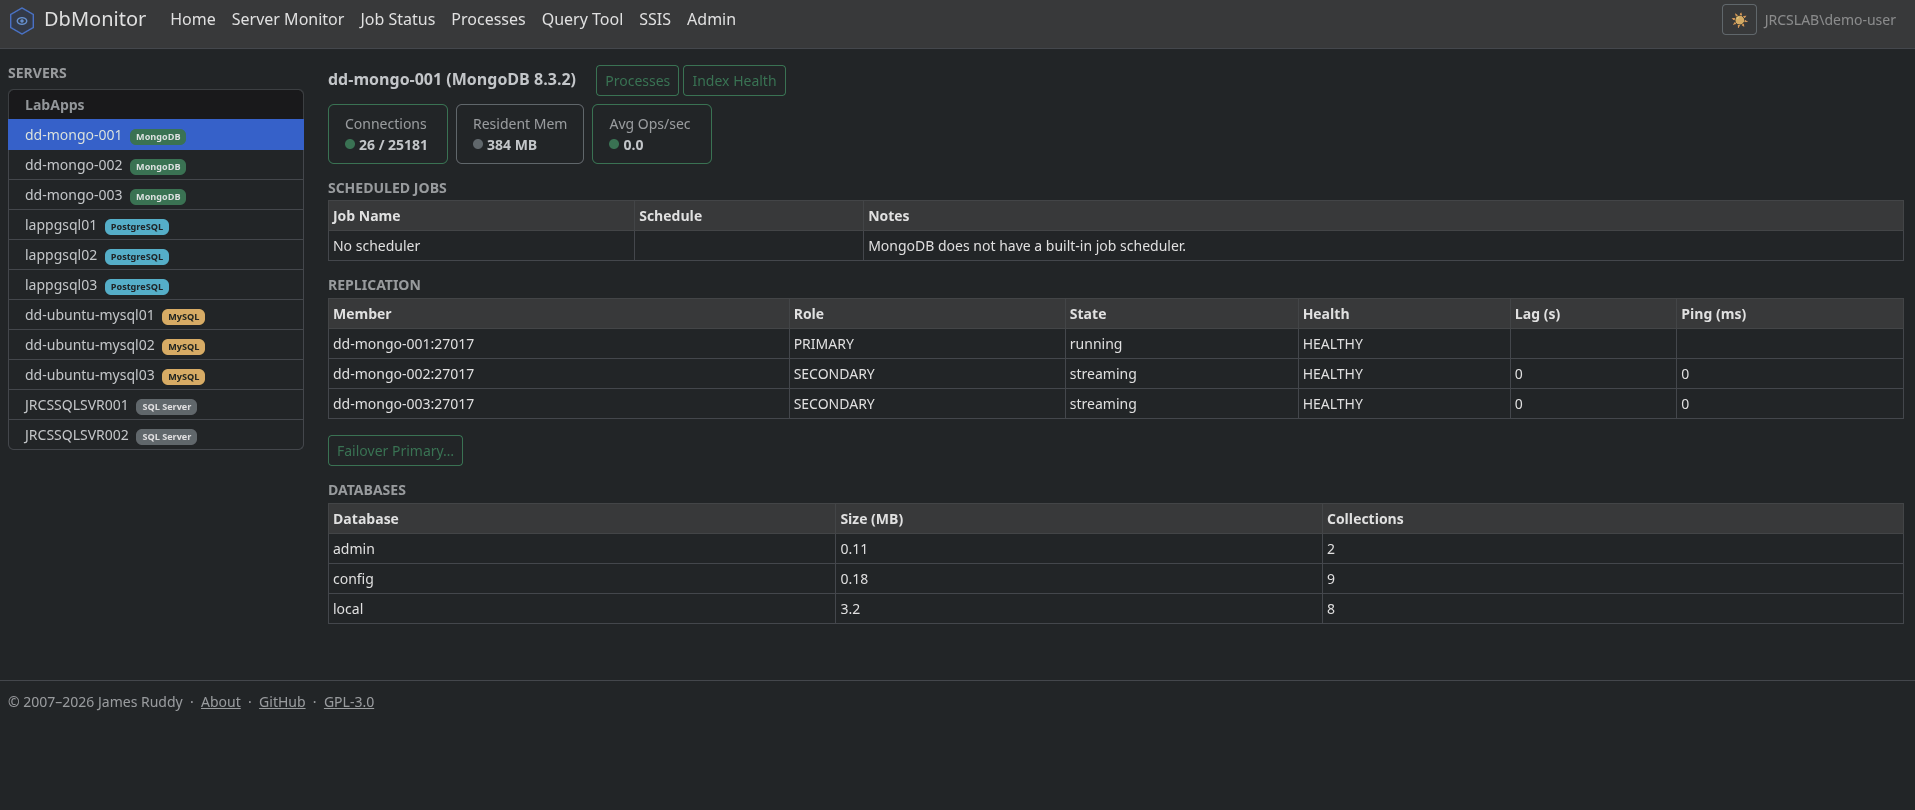
Server Monitor for MongoDB showing replica set health and pressure indicators

Server Monitor — MongoDB replica set health and pressure indicators.
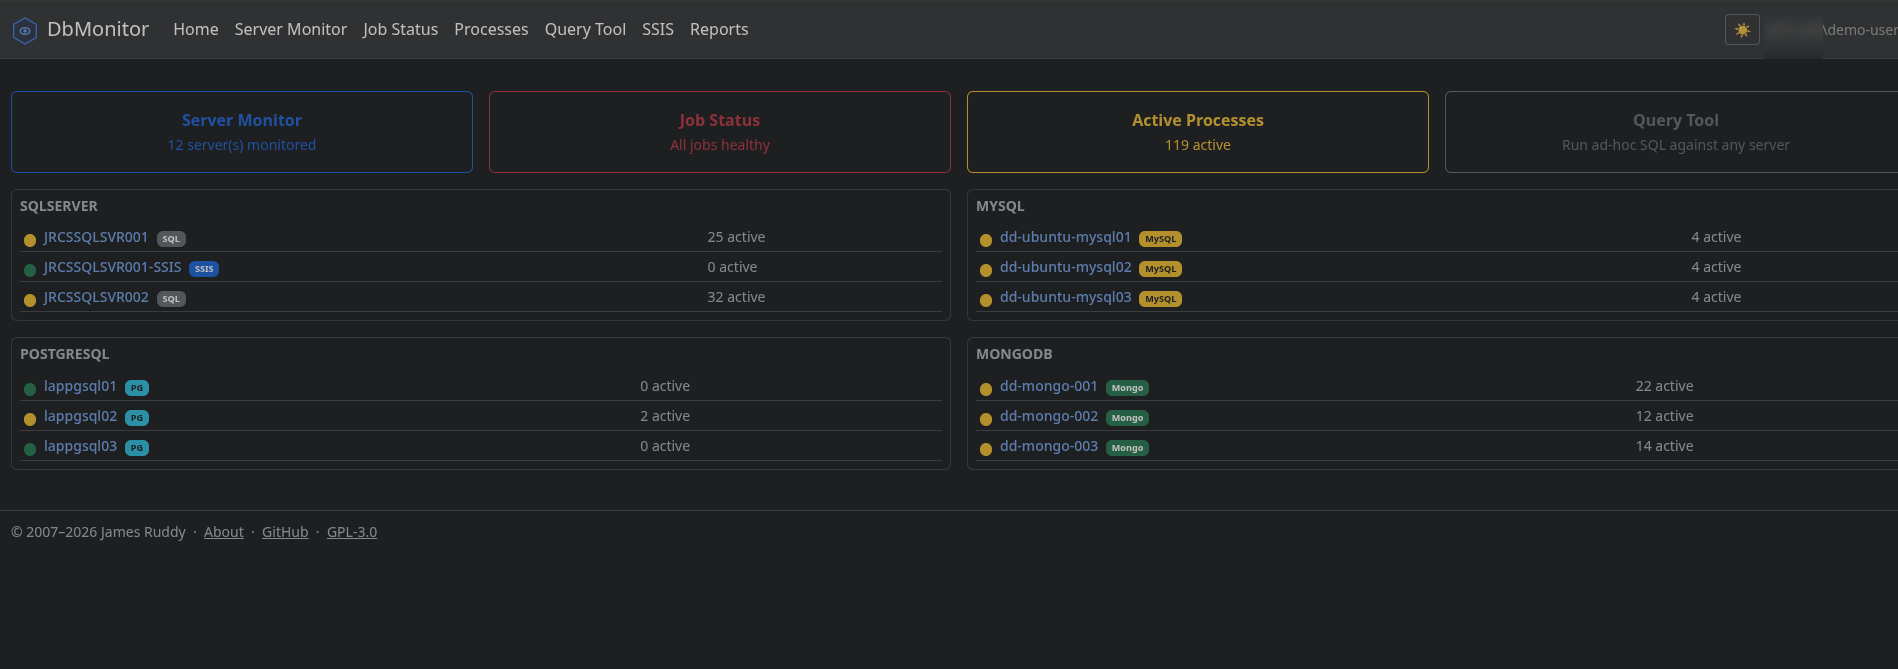
DbMonitor home page showing a server health grid across platforms

Home — server health grid across every monitored platform.

Feature overview

Monitoring, DBA actions, and admin

Monitoring

  • Server Monitor — per-server dashboard: health, jobs, replication topology, database inventory with backup dates and AG sync state
  • Pressure Indicators — CPU/PLE/memory (SQL Server), buffer pool hit ratio (MySQL), cache hit ratio (PostgreSQL), ops/sec (MongoDB)
  • Active Processes — live process list with lock/blocking detection, auto-refreshing every 5 seconds
  • Top Queries — worst performers ranked by CPU, elapsed time, or logical reads
  • Wait Stats — SQL Server and PostgreSQL wait event analysis
  • Index Health — fragmented and unused index reporting
  • Query Tool — ad-hoc queries across all platforms, with Kerberos-delegated identity for SQL Server
  • Execution Plan Viewer — graphical query plans rendered in-browser

DBA actions (sqldba group)

  • AG Failover — SQL Server Availability Group planned failover with automatic ASYNC→SYNC promotion
  • MySQL Failover — InnoDB Cluster primary election
  • PostgreSQL Failover — Patroni switchover via REST API with elapsed-time indicator
  • MongoDB Failover — replica set step-down with optional target promotion
  • Process Kill — terminate sessions across all four platforms
  • Stop Job — send stop signal to an executing SQL Agent job

Admin

  • Server Menu Editor, Category Management, and OSS monitoring credential management

Stack

Built on .NET, runs anywhere you already run Windows or Docker

LayerTechnology
Runtime.NET 10 · ASP.NET Core Razor Pages
DriversMicrosoft.Data.SqlClient/SMO · MySqlConnector · Npgsql · MongoDB.Driver
HA (PostgreSQL)Patroni REST API
UIBootstrap 5 · Chart.js · html-query-plan
AuthWindows Authentication (Negotiate/Kerberos) or local accounts
DeploymentIIS (Windows) · Docker (Linux)

Ready to try it?

Clone the repo, follow the deployment guide, and be watching your fleet in an afternoon.

Need compliance evidence too?

Add DbCollector when dashboards aren't enough for an audit

DbMonitor's optional Reports section connects to DbCollector, a commercial add-on that automates privileged account inventories, configuration drift, backup coverage, and other audit evidence across your fleet.

Learn about DbCollector